-min.png)
ProcMon+Wireshark🦈

Process Monitor stands as a crucial component within the suite of Sysinternals applications,
a collection of powerful tools offered by Microsoft to aid in various system analysis tasks.
Specifically designed to facilitate the troubleshooting of processes and the in-depth examination of
potential malware occurrences,
ProcMon plays a pivotal role in the realm of cyber analysis.
The Scenario
Issues:
- On this scenario we have a client that is crashing every time a notepad is being openned while trying to read a file from the server.
- Also, the client begins to run at 100% CPU when the file is being openned, then after its open it goes back to normal.
Our mission is to identify what is causing this issue. We are going to use the tools
ProcMonitor 🔍
WireShark 🦈
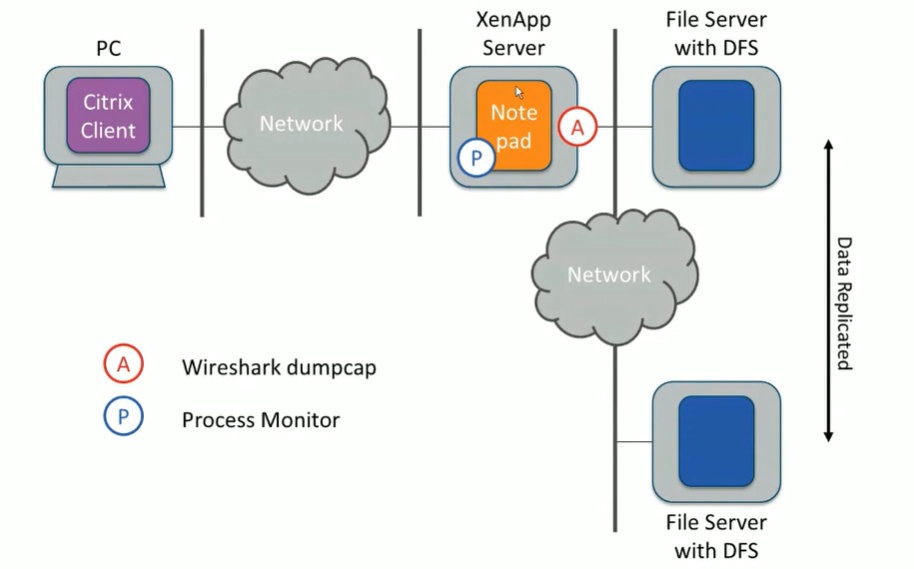
We going to need to install both software on the server to capture the data,
we just need to be careful with the data output
which can be quite large and we do not want to eat all the free space
from the C:/ which will cause performance issues.
Ideally, you want to output all the capture data on a separate external device, or somewhere outside the server itself.
The Process
We started our capture on both ProcMon and Wireshark, and replicated the problem which was causing issue,
on this case was the oppening a large file located on a network driver.
As the windows started to load and the text was not yet render on screen,
we had open a terminal ready to send a singular ping with lenght of 101 as soon as the text appears,
this will help us to identify the end of our trace.
ping -n 1 -l 101 192.168.3.1
After the item was loaded we can stop the capture and start analyzing.
Analyzing the Data
We can start at the WireShark 🦈 capture, and find our ping which we have sent with the length of 101 bytes Next we start looking up the stream when was the last 'read' which will be linked to our BigTextFile.txt

Wireshark filters used was ' SMB2 || icmp ' these will show packets for file transfer our ping.
We can then go into ProcMon and find our ping command, then trace back to the notepad.exe event
where we can look at the different call events that were being pushed into the stack.

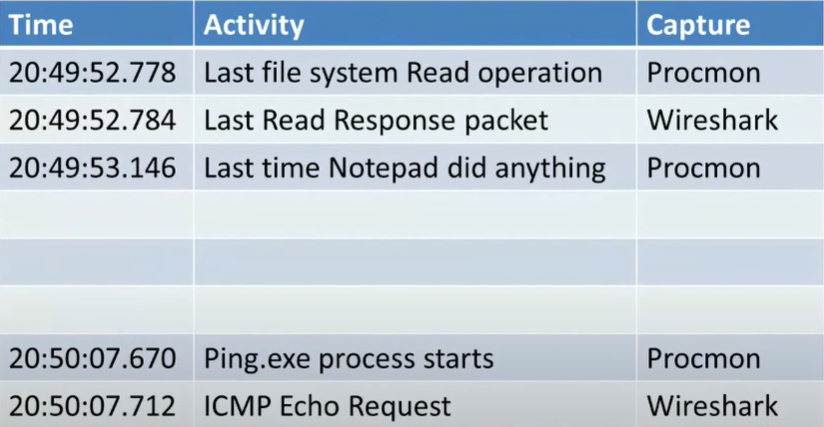
We are going to see there has a big gap between the time we last read the data across the network
and the time it was render on the window.
There will be a slightly variation in milliseconds on the calls from ProcMon and Wireshark. There are certain network calls which are not done by the appliation itself, like DNS for example, which is done by the svchost.exe, so we need to have that in mind when investigating an application.
The time of events displayed on ProcMonitor are display when the event completes, in contrasts, WireShark shows when the event started. We can see this difference when examining a 'SEND' event on ProcMon which will appear
Pro tip: ProcMon Drop Filtered Events
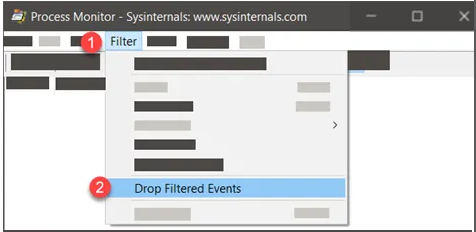
When you are troubleshooting an specific application you can adjust the settings to only show you the events that are part of the filter you have selected. When Drop Filtered Events is chosen, events that don’t meet the filter criteria are never added to the log, reducing the impact on log size. Obviously, that event data cannot be recovered later. This option affects only newly collected events. Any events that were already in the log are not removed.
Conclussion
By comparing the timestamps of the last 'read' event and the ping request, we can confirm whether the delay in rendering is related to the network transmission. If the ping request occurred significantly later, it suggests a delay in the network transmission itself.